Predictive Analytics for Local Marketing: A Complete Guide to Turning Data into Foot Traffic
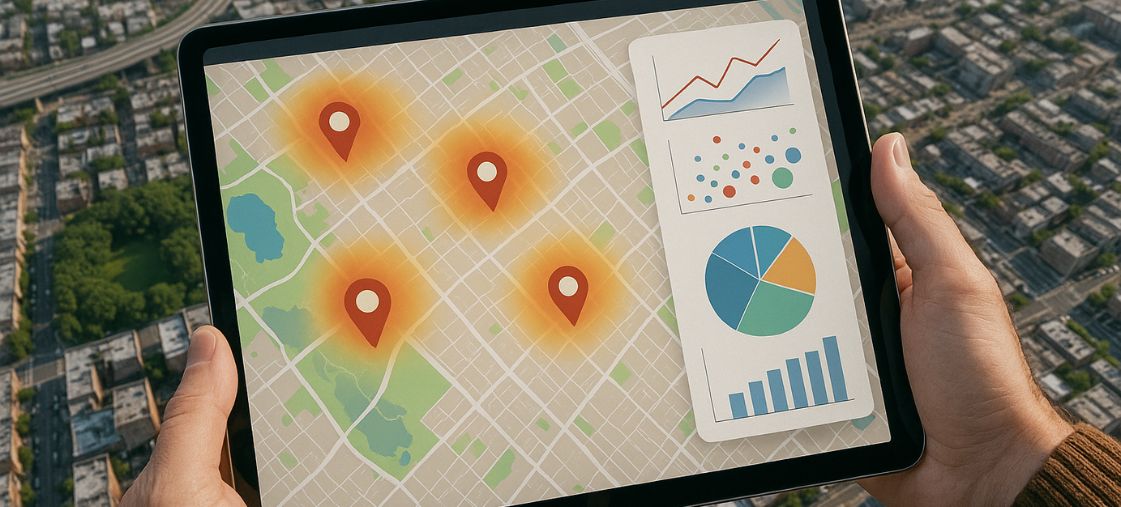
Predictive analytics for local marketing is transforming how neighborhood retailers, restaurants, clinics, gyms, and service providers attract and keep customers. Instead of guessing which offers will work, small and multi-location businesses can use historical data, machine learning, and real-time signals to forecast demand, segment audiences, time promotions perfectly, and allocate budget to channels that reliably convert into visits, bookings, or calls. Done right, predictive models amplify limited resources, shrink cost per acquisition, and make every local dollar work harder.
At its core, predictive marketing uses patterns in your past performance to anticipate the future—who is most likely to respond, when foot traffic will surge or dip, which neighborhoods are ripe for new customers, and what messaging resonates. If you want a quick primer on the broader trend shaping modern marketing, this clear overview on how predictive analytics is shaping the future of marketing is a helpful starting point before you dive into the local-specific playbook below.
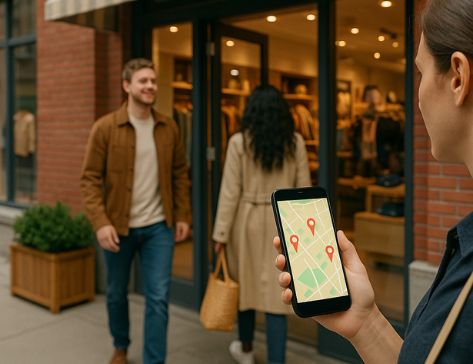
Why focus locally? Because local intent is uniquely time- and place-sensitive. A parent looking for “urgent care near me” at 7 p.m., a commuter searching “best tacos downtown,” or a homeowner comparing “same-day AC repair” all signal high purchase intent with immediate conversion potential. Predictive analytics lets you harness those micro-moments: forecast which zip codes will respond to mailers this week, predict which lapsed customers are ready to return, or identify the hours when a paid search bid boost will yield the most store visits measured via click-to-navigate and in-store POS matching.
To get there, you don’t need a massive data team—you need a practical system that ingests the right inputs and turns them into actionable predictions. A pragmatic blueprint for building your marketing data stack—covering pipelines, governance, and activation—is outlined in this hands-on guide on how to build marketing data systems. With even a lean stack, you can move from dashboards and hindsight to forecasts and foresight that guide daily operations.

What Exactly Is Predictive Analytics in a Local Context?
In simple terms, predictive analytics uses statistical models and machine learning to estimate the probability of a future event at a granular, local level. That could be a person booking an appointment, a household redeeming a coupon, a passerby walking in during lunch, or a lapsed customer reactivating this month. The output is usually a score (likelihood) or a forecast (expected demand) per audience, store, or time window. You then activate those predictions through ad platforms, email/SMS flows, on-site personalization, or even staffing and inventory decisions.
The Data You Actually Need (With Practical Examples)
You don’t need every data source under the sun. Start with a focused set of signals that map to your goals and can be refreshed weekly or daily. Here are high-ROI sources nearly any local business can assemble:
- First-party sales and bookings: POS transactions, online orders, appointment logs. Label outcomes like “purchase in 30 days” for training.
- Marketing touchpoints: Email opens/clicks, SMS replies, loyalty enrollments, website events, coupon redemptions, ad impressions/clicks.
- Location and context: Store geocoordinates, drive-time polygons, neighborhood demographics, weather, local events, school calendars.
- Supply/operations: Hours, staffing, inventory, service capacity, menu changes—these influence conversion and should be features.
- Competitive signals: Category ad intensity, review trends, new openings. Even simple proxies (e.g., Google Trends) add lift.
- Cost data: Channel CPM/CPC/CPA benchmarks to connect predictions to budget and expected ROI.
A Step-by-Step Playbook to Launch Predictive Local Campaigns
Step 1: Define one location-level goal
Pick a single KPI that directly ties to value: “in-store purchases within 7 days,” “appointments booked within 14 days,” or “phone calls > 60 seconds.” Keep the prediction window aligned to your buying cycle. Label your historical data with that exact outcome so the model learns the behavior you care about.
Step 2: Centralize your data (even if it’s messy)
Consolidate POS, web analytics, CRM/loyalty, and ad platform exports into one place (a spreadsheet to start, then a warehouse). Create stable IDs: customer, household, device, and location. For privacy, aggregate to cohort or zip-code when individual IDs aren’t available. Your first version can be simple—consistency beats complexity.
Step 3: Engineer local features
Create features that reflect local reality: distance to store, rain in last 24 hours, day-of-week, paydays, school in session, last purchase recency, average basket, coupons redeemed, and preferred channel. Add neighborhood-level stats (median income, renter vs. owner, density) to capture socioeconomic context without overfitting to individuals.
Step 4: Choose a pragmatic model
Start with interpretable baselines like logistic regression or gradient-boosted trees. They’re fast, accurate, and easy to explain to stakeholders. Use cross-validation and backtesting by week to mimic real activation. Focus on lift in the top decile of scores (e.g., how much better your top 10% scored audience converts vs. average), not just AUC.
Step 5: Validate with holdout stores or zip codes
Hold back several locations or zip codes as a clean test set. After training, run campaigns only on predicted-high audiences in the test geos, and compare against matched controls (similar locations/time periods). Track incremental visits, orders, or calls—not just clicks. This isolates real-world impact from seasonality or brand noise.
Step 6: Activate the predictions
Route top-scoring audiences to channels: boost bids in paid search within a 3–5 mile radius; sync lookalikes on social; send SMS for time-sensitive offers; schedule email journeys for reactivation; print mailers to high-propensity carrier routes. For store ops, align staffing and inventory with predicted peaks to cut wait times and stockouts.
Step 7: Measure, learn, and iterate
Compare predicted vs. actual outcomes weekly. Refit the model as new campaigns run so it learns from fresh behavior. Monitor feature drift (e.g., a new competitor opens) and recalibrate thresholds per location. Document what worked (offer types, timing, channel mix) and feed those learnings into the next cycle.
Channel Tactics Informed by Predictions
- Search: Increase bids during predicted demand spikes; add sitelinks for fastest paths to booking or directions.
- Social: Build creative variants per neighborhood persona; suppress low-propensity segments to reduce waste.
- Email/SMS: Trigger journeys when propensity crosses a threshold; cap frequency for low-likelihood cohorts.
- Direct mail: Send to routes with high household propensity scores; test larger formats during seasonality peaks.
- On-site: Personalize homepage modules by nearest store and predicted category interest (e.g., lunch vs. dinner).
Governance, Privacy, and Data Quality
Respect privacy and comply with relevant regulations by minimizing use of personally identifiable information and favoring aggregated, consented data. Create a data dictionary so teams know what each feature means and how often it updates. Institute data quality checks for missing values, duplicate IDs, and outliers. Accuracy upstream saves headaches downstream.
Common Pitfalls (and How to Avoid Them)
- Overfitting to history: Backtest by time and hold out stores to ensure generalization.
- Chasing vanity metrics: Optimize for booked appointments or visits, not clicks.
- Too many features: Start small; remove low-importance variables regularly.
- Ignoring operations: Predictions without staffing/inventory alignment disappoint customers.
- One-size-fits-all thresholds: Calibrate per location based on capacity and local demand.
- Set-and-forget: Retrain as seasons, competitors, and consumer behavior change.
How to Prove ROI
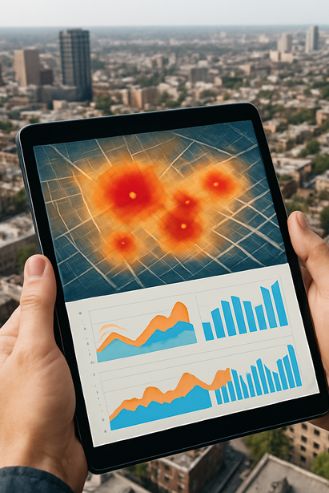
Frame your measurement around incrementality. Use geo-based holdouts, pre/post analyses, or matched-market experiments. Translate gains into business terms: “Predictive audiences delivered 32% higher visits and reduced CPA by $7” is more compelling than “+0.06 AUC.” Share win stories at the store level to build buy-in and surface frontline insights you can encode as features later.
Conclusion
Predictive analytics for local marketing turns scattered data into a daily advantage: the right message to the right people at the right time—and at the right store. Start with a single outcome, assemble a lean dataset, and deploy practical models that you can explain and maintain. As you mature, expand channels, add richer features, and automate activation. Competitive intelligence tools, including native ad research platforms, can complement your first-party predictions by revealing creative and placement patterns that win in your category. The payoff is durable: compounding lift in visits, higher repeat rates, and marketing spend that gets measurably smarter every week.


