Predictive Analytics for Social Media: A Practical Guide to Forecasting Engagement and Growth
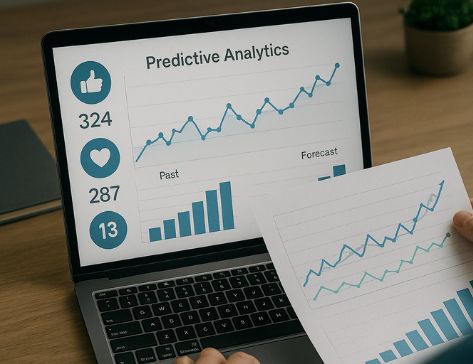
Predictive analytics for social media is transforming how brands forecast trends, allocate budgets, and craft content that resonates before it even posts. By mining historical engagement and real-time signals, teams can anticipate what audiences will like, click, and share—then act with confidence. In a noisy feed and tightening ad markets, foresight is more than a competitive edge; it’s a safer, smarter way to grow.
At its core, predictive models convert patterns into probabilities: the likelihood a video will be saved, a carousel will be shared, or a hashtag will trend. If you’re just exploring the space, this concise industry overview of how predictive analytics is shaping social media’s future captures why leading teams are building forecasting into everyday workflows.
The business value compounds fast. With reliable forecasts, marketers can schedule posts in optimal windows, pre-approve paid boosts for likely winners, and identify content themes that punch above their weight. Creators can iterate faster, community managers can flag risk earlier, and data teams can tie content decisions to measurable outcomes like cost per engagement, customer acquisition, and lifetime value.
Success, however, isn’t only about models—it’s about repeatable operations. Treat your predictive program like a product: define goals, ship iteratively, and measure impact. For a structured operations mindset, this step‑by‑step playbook for sustainable marketing growth offers a solid template for teams formalizing their data-driven workflows.

What Is Predictive Analytics for Social Media?
Predictive analytics for social media uses historical and real-time signals to estimate future outcomes: reach, clicks, conversions, sentiment, churn risk, and more. Techniques span classical time-series (ARIMA, ETS), machine learning (Random Forest, Gradient Boosting), and deep learning (LSTM, Temporal CNN, Transformers). The right path depends on data volume, freshness, explainability needs, and your team’s skill set.
Common Signals
- Post-level features: caption length, keywords, CTA type, media format (image/video/carousel), duration, aspect ratio.
- Timing features: day of week, hour of day, holidays, seasonality, recency since last post.
- Audience signals: follower growth, active cohorts, geographic mix, device breakdown.
- Context signals: trending audio, hashtag velocity, competitor activity, macro events.
Typical Predictions
- Engagement (likes, comments, saves, shares) and engagement rate.
- Video outcomes (view-through rate, 3‑second views, watch time, completion).
- Paid performance (CPM, CPC, CPA) and budget allocation suggestions.
- Content theme win rates and optimal posting windows.
How It Works: From Data to Decision
Every successful predictive system follows a simple pipeline: collect → clean → feature → model → validate → deploy → monitor. The sophistication grows with your data maturity, but the fundamentals stay stable.
- Ingest: Pull post, ad, and audience data via platform APIs or analytics exports. Ensure timestamps are normalized to a single timezone.
- Clean: Deduplicate posts, standardize field names, and fix missing or outlier values (e.g., winsorize extreme impressions).
- Feature: Create informative variables—rolling averages, lagged metrics, time bins, topic clusters, and media descriptors.
- Model: Start simple (regularized regression, baseline ARIMA), then layer tree models or deep learning if lift plateaus.
- Validate: Use time-aware splits (forward chaining). Track MAPE, sMAPE, MAE, and business metrics like uplift and ROI.
- Deploy: Serve predictions where decisions happen—content calendar, ad planner, or CRM—so the insights get used.
- Monitor: Watch data drift and concept drift; alert on degradation; retrain on a schedule or event triggers.
Step-by-Step Implementation (A 30–60 Day Plan)
- Define the question: Pick one outcome (e.g., saves within 48 hours) and one channel. Tight scope accelerates learning.
- Assemble a dataset: 12–24 months of posts with engagement and basic metadata. Add campaign flags and content themes.
- Engineer quick-win features: Posting hour, day of week, rolling 7/28‑day engagement, media type, caption length buckets.
- Baseline: Fit a simple time-series or regularized regression. Establish a performance floor to beat.
- Improve: Try Gradient Boosting (XGBoost/LightGBM) with careful time splits. Add interaction terms and text embeddings.
- Operationalize: Pipe daily predictions into the editorial calendar. Color‑code posts by predicted tier (top 10%, 25%, etc.).
- Experiment: A/B test “predict‑informed” posting windows, hashtags, or creative variants against business-as-usual.
- Expand: Add paid outcomes (CPC/CPA) and budget reallocation suggestions once organic models are stable.
- Govern: Document assumptions, data sources, and retraining cadence. Establish a clear rollback plan.
Model Choices: What to Use When
Classical Time-Series
Methods like ARIMA, ETS, and Prophet (trend/seasonality) are fast to train, interpretable, and great baselines for channel‑level forecasts (e.g., daily reach). They struggle when rich, high‑dimensional features (text, media descriptors) drive most of the signal.
Tree-Based ML
Gradient Boosting and Random Forests handle non-linearities well, thrive on tabular features, and deliver strong accuracy with modest tuning. Pair with robust cross‑validation and SHAP values for explainability to help editors understand “why.”
Deep Learning
LSTMs, Temporal CNNs, and Transformers shine with sequence data and mixed modalities (text + video descriptors). They can capture long‑range dependencies and trend breaks but require more data, compute, and MLOps rigor. Consider once simpler models plateau and you have monitoring in place.
Key Metrics That Actually Matter
- Error metrics: MAPE/sMAPE for scale‑free error, MAE for robustness, RMSE for penalizing large misses.
- Business metrics: Uplift in engagement rate, CPM/CPC/CPA improvements, incremental conversions, and forecast‑informed budget ROI.
- Decision metrics: Precision@K for “top post” picks, calibration (do 0.7 probabilities hit ~70%?), and coverage.
Practical Tips to Improve Accuracy
- Engineer time wisely: Include hour‑of‑day, day‑of‑week, month, holidays, and platform‑specific cycles.
- Capture recency: Rolling 3/7/28‑day engagement and posting cadence often drive near‑term outcomes.
- Use text features: Keyword presence (CTA verbs), sentiment, reading level, and embedding vectors for themes.
- Handle outliers: Cap extreme virality and crisis spikes, or model them separately to avoid skewing parameters.
- Segment smartly: Separate models for Reels vs. static posts, B2B vs. B2C, or regions with distinct behavior.
- Monitor drift: Track input distributions and residuals; retrain when drift is detected or on a set cadence.
- Close the loop: Feed experiment results back into features—what worked becomes tomorrow’s prior.
Ethics, Privacy, and Platform Policies
Respect privacy and comply with platform terms. Avoid collecting sensitive personal data beyond what’s permitted by APIs. Minimize retention of raw user data, aggregate when possible, and document consent flows. Good governance isn’t just compliance—it’s trust with your community.
Common Mistakes (And How to Avoid Them)
- Optimizing the wrong target: Predicting likes when business value comes from saves, shares, or conversions.
- Data leakage: Using future information (e.g., 7‑day totals) in features for day‑0 predictions.
- Ignoring seasonality: Launching in Q4 and assuming Q1 performance is comparable without adjustments.
- No decision integration: Predictions live in a dashboard nobody opens. Embed them into calendars and ad planners.
- Under‑investing in monitoring: Models decay as trends shift. Set alerts, thresholds, and retraining policies.
A Lightweight Tooling Stack
Start simple: spreadsheets for data audits, a Python notebook for feature engineering and baselines, and a lightweight database (SQLite/Postgres) for storage. Add a scheduler (cron/GitHub Actions) to refresh predictions nightly. As you mature, move to managed notebooks, feature stores, and orchestration (Airflow/Prefect) with CI/CD and model registries.
Use Cases and Quick Wins
- Content calendar optimization: Predict post‑hour uplift; shift slots to maximize engagement.
- Creative iteration: Identify top‑performing themes and prompts; brief creators with evidence.
- Paid boost pre‑approval: Flag likely winners before posting and set auto‑boost thresholds.
- Community prioritization: Forecast which posts will drive comments and allocate moderation time.
- Trend scouting: Score trending audio/hashtags by fit and expected lift for your audience.
Mini Checklist Before You Launch
- One outcome metric defined and mapped to business value.
- At least 12 months of clean data and time‑aware validation splits.
- Baseline and improved models with documented lift.
- Deployment path into the actual decision surface (calendar, planner, CRM).
- Monitoring and retraining policy with clear owners and SLAs.
Conclusion
Predictive analytics for social media turns guesswork into an evidence‑based creative advantage. Start with a single outcome, build a trustworthy baseline, and wire predictions directly into how your team plans, posts, and promotes. As your models mature, expand to budget optimization and cross‑channel planning. To complement your strategy with competitive insights and ad creative intelligence, explore modern in‑stream analytics tools that help you spot opportunities faster and act with greater precision.


