
Predictive Analytics for Social Media: A Practical Guide to Forecasting Engagement and Growth
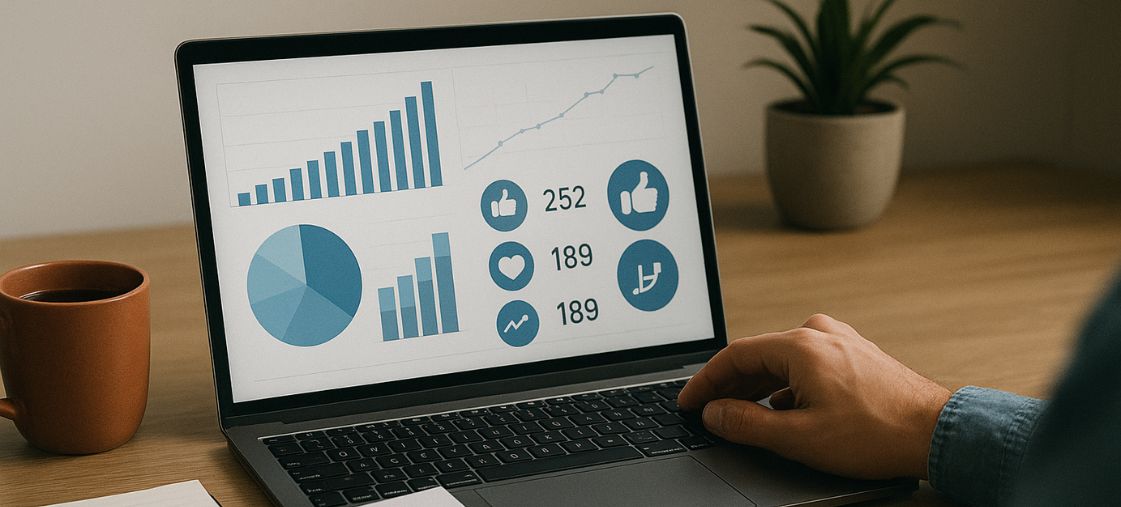
Predictive Analytics for Social Media: A Practical Guide to Forecasting Engagement and Growth Predictive analytics for social media is transforming how brands forecast trends, allocate budgets, and craft content that resonates before it even...